Kanteron introduces Flexible AI
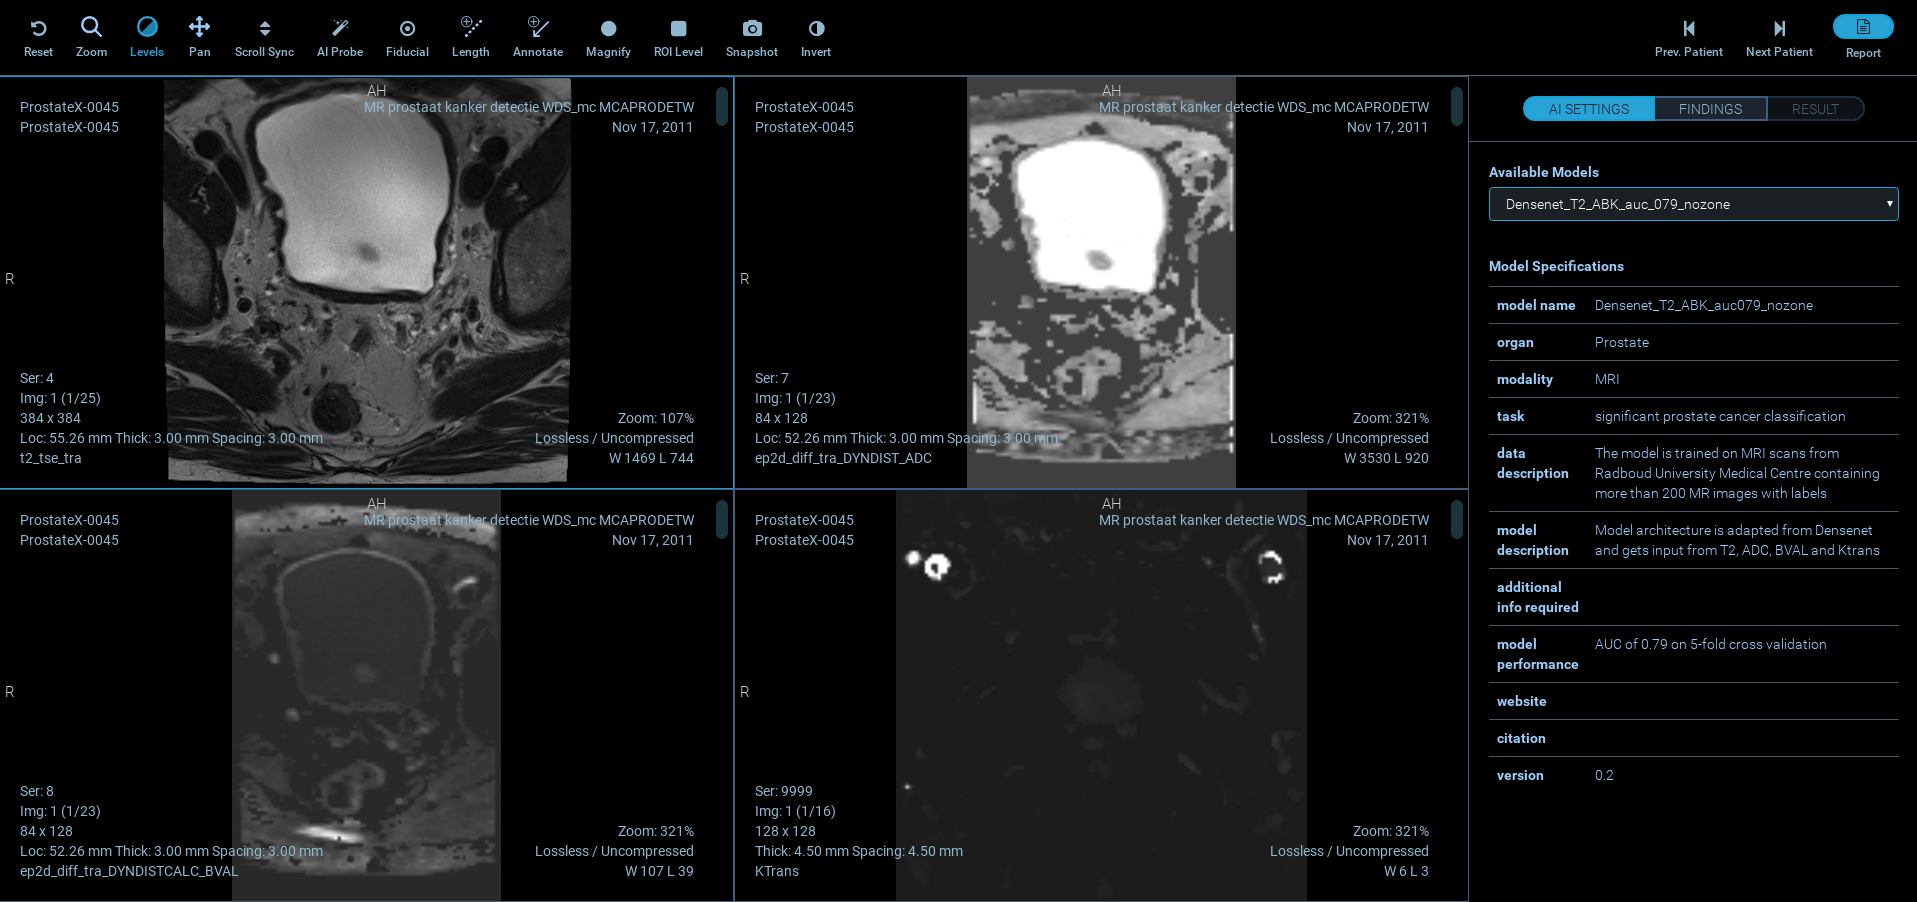
Flexible AI means you can choose the data set that best fits your use case, and apply it to your relevant medical images. We include a training set for Prostate Cancer as a starting point, but that’s only the beginning! The AI setting allows the user to choose the desired model from the list of all available models along with their descriptions.
Flexible AI is the result of a collaboration of the Medical Informatics Laboratory at Queen’s University and Surgical Planning Laboratory at Harvard Medical School, which enables deployment of AI models for radiologists’ second opinion with the help of AI, while simultaneously providing standard image viewing and reporting schemes.
We’re looking for customers-partners who would like to be pioneers in the application of AI in medical imaging and build their own expertise on a flexible platform that will allow them the freedom to apply this exciting technology to many use cases. Furthermore, we definitely want to work with you if you also want to correlate Pathology imaging and Genomic data with Medical Imaging, in a way that only Kanteron’s Platform allows today.
If you would like to be one of the trailblazers and leverage the latest and most flexible AI solution available for medical imaging, please contact us!
Technical details.-
AI component is developed in Flask (Python microframework) and each AI model is wrapped into an application program interface (API) endpoint. Prediction time is less than a second for each finding on a CPU machine; however, models can be written in a way to benefit from the power of GPUs.
For each case, the application presents 4 separate MR image stacks of T2-weighted images, ADC map, high b-value DWI, and Ktrans map obtained from contrast-enhanced imaging. After choosing the desired AI model, the user can locate the probe at any location on images to view the result of the AI prediction (the user can confirm or dismiss a finding after inspecting the AI prediction). The information will then be passed along to reporting using PI-RADS v2. The application gives the user a feedback message projection of the results on the 4 image views and histologically proven outcomes. Relative distances (in mm) between user-defined findings and biopsy locations are also calculated and displayed.
The included model is trained on MRI scans from Radboud University Medical Centre (Nijmegen) containing more than 200 MR images with labels. The Model architecture is adapted from Densenet and gets input from T2, ADC, BVAL and Ktrans, with a model performance AUC of 0.8 on 5-fold cross validation.
T2 scoring /DWI scoring / DCE Scoring for Peripheral Zone (PZ) or Transition Zone (TZ) leading to PI-RADS Overall Scoring- Peripheral Zone (a) and Transition Zone (b).
PI-RADS v2 intends to standardize reporting of mpMRI scans to reduce variability in interpretations and summarize levels of risk/suspicion for clinically significant cancer. https://www.acr.org/-/media/ACR/Files/RADS/Pi-RADS/PIRADS-V2.pdf Hassanzadeh E, Glazer D, Dunne R, Fennessy F, Harisinghani M, Tempany C. Prostate imaging reporting and data system version 2 (PI-RADS v2): a pictorial review. Abdominal Radiology. 2016;42(1):278-289. doi:10.1007/s00261-016-0871-z